Occupational Employment Projections Explorer Dashboard
Dashboard Navigation
-
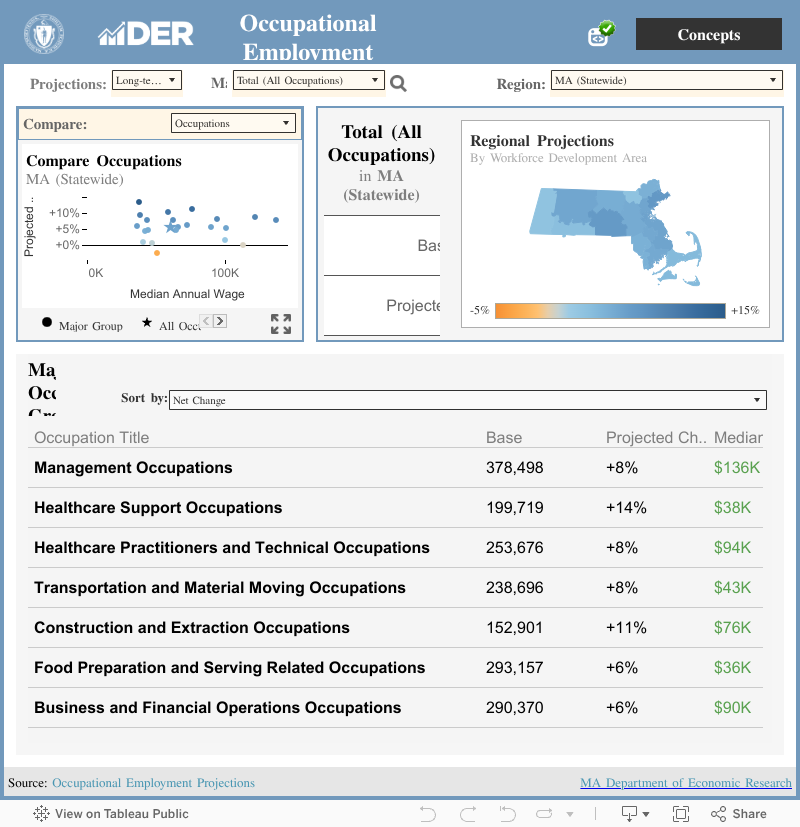
Timing: Use the Projections drop down menu to select long-term or short-term projections.
-
Occupational Group: Use the Occupation drop down menu to select a major occupational group or select “All Occupations.” When any level of occupational grouping is selected in the dashboard, through the drop-down or by clicking, its sub-groups are included at the bottom of the dashboard. Users can search for specific occupations by clicking the “search” tab at the top of the dashboard. A full list of SOC groups and occupations can be found on the Bureau of Labor Statistics website. For more information on occupations, see Definitions and Methodology.
-
Geography: The dashboard defaults to state-wide data for Massachusetts. Use the Region drop down menu to view data for a specific Workforce Development Area (WDA).
How to use the Occupational Employment Projections Explorer
The occupational employment projections explorer dashboard can be used to examine projected change of various occupational groups and sub-groups.
-
Select an occupation or occupational group to view base and projected employment, net change (# and %), and median annual wages. View and sort sub-groups of the selected occupation or occupational group using the bottom half of the dashboard.
-
Use the scatter plot on the left of the dashboard to compare projected change and typical wages across occupations for a specific geography, or across geographies for a specific occupation or occupational group.
-
Use the map on the right of the dashboard to compare projected change via Workforce Development Area (WDA).
-
Hovering your cursor over dashboard elements will reveal additional information.
-
Click the concepts tab (or see Definitions and Methodology) for definitions and links to download data.